











Choosing a fixed-wing drone propeller is only one part of achieving a reliable aircraft configuration. A practical fixed-wing UAV propeller layout guide must also address how to choose a propeller for a fixed-wing drone and the correct pusher propeller placement for UAV applications. The design should balance thrust-to-weight ratio, center of gravity, and aerodynamic efficiency while accounting for advance ratio, propeller disk loading, and Reynolds number. This article explains how integrators can select, position, test, and validate a propeller system for mapping, surveillance, inspection, and long-endurance missions.
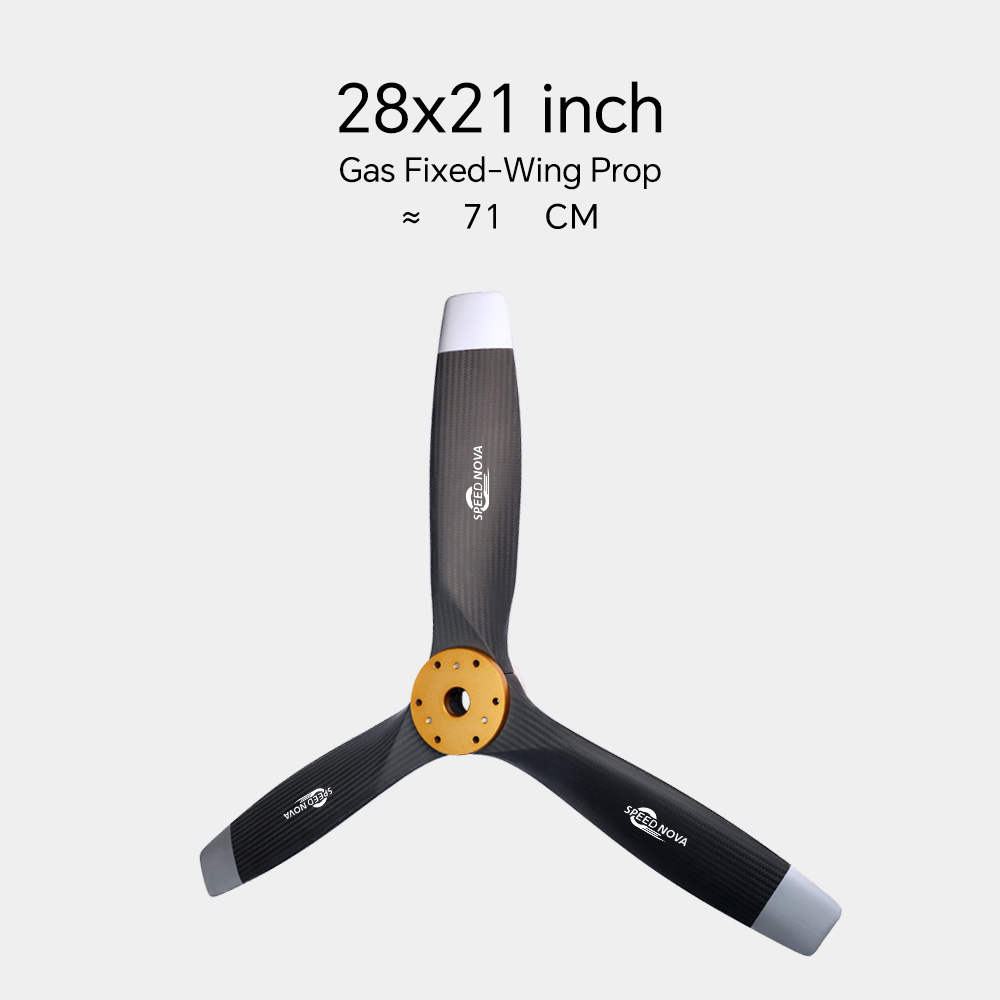
For a UAV integrator, the propeller is an interface between the powertrain and the airframe. Its diameter, pitch, blade geometry, rotation direction, and installation position affect takeoff distance, climb rate, cruise power, cooling, vibration, payload capacity, and endurance. A propeller that performs well on a test stand may produce different results after installation because the fuselage, wing, landing gear, payload bay, and empennage alter the airflow.
The most common integration failures are not caused by a single incorrect specification. They usually come from a mismatch between the propeller operating point and the mission profile. Typical examples include:
The goal is therefore not to find the largest propeller or the highest motor rating. The goal is to achieve an acceptable operating point across all mission phases while maintaining structural clearance, thermal margin, noise control, and predictable flight behavior.
Diameter is the full circle swept by the blades. Increasing diameter generally increases the air mass accelerated by the propeller and can improve static efficiency, but it also increases torque, tip speed, structural load, and ground-clearance requirements.
Geometric pitch is the theoretical distance a propeller would advance in one revolution without slip. A higher-pitch propeller usually favors higher airspeed, while a lower-pitch propeller often provides stronger static and low-speed performance. The actual advance per revolution is lower than geometric pitch because of aerodynamic slip.
For a first estimate, pitch speed can be calculated as:
This is not a flight-speed guarantee. A propeller with a 12-inch pitch at 6,000 RPM has a theoretical pitch speed of approximately 30.5 m/s before slip losses. The actual aircraft speed may be lower because of induced drag, profile drag, propeller slip, and installation effects.
Propeller thrust is commonly represented by:
Propeller power is represented by:
Where:
These relationships explain why a small change in diameter can have a significant effect. At the same RPM and air density, thrust varies approximately with the fourth power of diameter, while power varies approximately with the fifth power. A 10% diameter increase may theoretically increase thrust by about 46% and power demand by about 61%, although real-world results depend on blade geometry and operating conditions.
The advance ratio is:
Here, V is aircraft speed, n is revolutions per second, and D is propeller diameter. Static testing has an advance ratio close to zero. Cruise operation may have a substantially higher value. A propeller optimized for static thrust may therefore be inefficient during cruise, while a high-speed propeller may provide inadequate launch and climb performance.
Propeller efficiency can be approximated by:
Efficiency should be evaluated at the aircraft’s real operating points rather than quoted as a single universal number. Blade-section performance is also affected by Reynolds number, which changes with local blade speed, aircraft velocity, chord length, and air density. Small UAV propellers often operate at lower Reynolds numbers than full-scale aircraft propellers, making surface finish, blade section, and manufacturing accuracy especially important.
A tractor configuration places the propeller ahead of the motor or fuselage and pulls the aircraft through the air. Its main advantages include relatively clean propeller inflow, direct cooling airflow over the motor, and straightforward thrust-line alignment.
A tractor propeller is often suitable when:
However, the propeller may disturb an optical payload mounted near the nose and can be exposed during belly landings. The propeller arc must be checked against the ground at the maximum landing attitude, not only against the nominal geometric ground line.
A pusher configuration places the propeller behind the motor or fuselage. It can provide a clean nose for cameras, LiDAR, multispectral sensors, and other payloads. It may also simplify modular payload access and protect the propeller during some launch procedures.
The main engineering concern is inflow quality. A rear propeller may ingest fuselage boundary-layer flow, wing wake, landing-gear wake, or disturbed flow from a blunt payload enclosure. This can reduce propeller efficiency and create periodic blade loading, which may increase vibration and acoustic signatures.
For a pusher installation, examine:
A pusher layout is not automatically less efficient than a tractor layout. Its performance depends on the geometry of the upstream airframe and on whether the propeller is designed for non-uniform inflow.
Twin-engine layouts can improve redundancy and provide more flexible packaging, but they introduce asymmetric-thrust and failure-mode considerations. The propellers should be positioned to minimize interaction with the fuselage and wing while preserving adequate ground clearance.
Coaxial or contra-rotating systems can produce high thrust in a limited diameter, but they require precise axial spacing, rotation control, and structural alignment. The rear rotor operates in the wake of the front rotor, so total efficiency and noise must be measured rather than inferred from the individual propeller data sheets.
Begin with the flight conditions that the aircraft must actually meet. At minimum, record:
Do not size the propulsion system only around maximum static thrust. A mapping UAV may spend most of its mission at a narrow cruise speed, while a delivery or surveillance platform may require repeated climb segments. Create at least three design points: launch or takeoff, climb, and cruise.
Estimate the aircraft weight in newtons:
For a hand-launched fixed-wing UAV, a static thrust-to-weight ratio between approximately 0.5 and 0.8 may be adequate depending on wing loading, launch technique, and propeller clearance. A platform that must accelerate rapidly, operate from a short runway, or climb with a heavy payload may require a higher ratio. These are starting ranges, not certification limits.
For example, a 7.5 kg aircraft weighs approximately 73.6 N. A target static thrust ratio of 0.65 corresponds to about 47.8 N of static thrust. The final propeller should still be checked at the expected climb airspeed because static thrust can overstate climb performance.
Use a motor-propeller test database or a calibrated thrust stand to compare candidate propellers. The required data should include:
The maximum continuous current of the ESC should exceed the measured current with a defined engineering margin. For example, if the installed system draws 42 A continuously during a hot-weather climb test, selecting a 45 A ESC leaves little practical margin. A 60 A or higher unit may be more appropriate, provided the battery, wiring, connectors, and cooling system are also rated for the load.
Motor RPM is approximately related to motor speed constant and voltage, but load, battery sag, and motor efficiency change the result. Use measured loaded RPM rather than the no-load RPM printed on a motor label.
Propeller tip speed should remain below the regime where compressibility and noise become dominant. The approximate helical tip speed is:
Keeping the helical tip speed below approximately Mach 0.65 to 0.70 is a common design target for electrically powered UAV propellers, although blade section, atmospheric conditions, and acoustic requirements may justify a lower limit. At sea-level standard conditions, Mach 0.70 is roughly 238 m/s. The exact value changes with temperature.
Clearance must be checked in three dimensions and across the complete operating envelope. Include:
A practical clearance drawing should show the propeller disk, blade-tip path, fuselage, wing, empennage, ground plane, and nearby wiring. The minimum numerical clearance depends on the airframe material and recovery method, but the design should include a documented tolerance rather than relying on visual judgment.
The propeller thrust line should be measured relative to the aircraft’s longitudinal, lateral, and vertical reference axes. An offset thrust line can generate pitch or yaw moments. The approximate pitching moment caused by a vertical offset is:
Where T is thrust and h is the perpendicular distance from the thrust line to the aircraft reference point. If a 50 N thrust line is positioned 0.04 m below the center of gravity, the resulting moment is approximately 2.0 N·m.
Moving the motor or battery can also alter the center of gravity. For a component mass shift:
A 1.2 kg battery moved 80 mm in a 7.5 kg aircraft changes the longitudinal center of gravity by approximately 12.8 mm. That shift may be significant for a small UAV, particularly when the acceptable CG range is only a few percent of mean aerodynamic chord.
Motor, ESC, and battery temperatures should be measured under the most demanding realistic condition, such as high ambient temperature, low airspeed, maximum payload, and sustained climb. Use thermocouples or calibrated telemetry sensors attached to the motor windings or stator region, ESC heat sink, and battery cells.
A system that remains below a component’s absolute temperature limit may still lack operational margin. For example, if an ESC reaches 82°C during a 35°C ambient test, its margin for a hotter day, blocked inlet, or reduced airflow is limited. Thermal testing should include the actual cowling, propeller, battery compartment, and flight controller installation.
Propeller imbalance produces centrifugal force that increases with the square of rotational speed. A small mass error can therefore become significant at high RPM. Use a propeller balancer for static balance and, where possible, an accelerometer or vibration analyzer for dynamic evaluation.
Record vibration near the motor mount, flight controller, camera, and payload. Excessive vibration can cause inertial measurement unit errors, image blur, connector fatigue, and premature bearing wear. Balance the propeller, inspect the shaft and adapter, verify motor-mount flatness, and check blade tracking after installation.
A repeatable integration program normally uses the following tools:
| Tool | Primary purpose | Useful measurement |
|---|---|---|
| Calibrated thrust stand | Propeller and motor comparison | Thrust, torque, RPM, current, voltage |
| Optical or magnetic tachometer | Loaded RPM verification | RPM under static and dynamic conditions |
| Thermocouples and telemetry | Thermal validation | Motor, ESC, battery, and compartment temperature |
| Vibration accelerometer | Structural and payload protection | Frequency peaks and acceleration amplitude |
| Power analyzer | Electrical system sizing | Voltage sag, current, watt-hours, peak load |
| CAD clearance model | Mechanical integration | Propeller arc, ground clearance, interference |
| Wind tunnel or flight-test instrumentation | Installation-effect evaluation | Thrust and efficiency at airspeed |
When a wind tunnel is not available, flight testing can still generate useful data. Log airspeed, GPS groundspeed, wind estimate, RPM, current, voltage, pitch attitude, climb rate, and battery energy. Repeat each test in opposite headings to reduce the influence of wind.
Consider a 7.5 kg electric mapping UAV with a 2.4 m wingspan, a 28 m/s target cruise speed, and a 2.5 m/s required climb rate. The integrator compares a front-mounted tractor system with a rear-mounted pusher system.
The pusher configuration provides the preferred payload view, but its cruise power is approximately 9.7% higher than the tractor configuration in this test. The result suggests that fuselage wake and cooling restrictions are influencing performance. The pusher may still be selected if payload quality is more valuable than the additional energy consumption, but the integrator should test a longer motor standoff, a revised tail-cone shape, or an alternative propeller designed for non-uniform inflow.
This example demonstrates why layout selection should be based on mission-level data. A nominally lower static-thrust configuration may still deliver the better operational solution when the aircraft spends most of its time in cruise and the payload requires a clear forward field of view.
Static thrust is easy to measure, but it does not represent cruise performance. Always compare power required at the target airspeed. If the aircraft cruises at 25 to 30 m/s, test or model the propeller at that operating range.
A battery labeled “6S” does not deliver a constant 22.2 V under load. Internal resistance, temperature, state of charge, and current can reduce terminal voltage. A voltage drop from 22.2 V to 20.5 V changes motor RPM and may reduce thrust while increasing current demand in some operating conditions.
Folding propellers can reduce drag during gliding, but blade deployment must be verified during motor startup, rapid throttle changes, inverted attitudes, and propeller braking. Check blade-stop wear and ensure that the folded blades cannot contact the fuselage or wing.
Propeller slipstream can change local dynamic pressure over the elevator or rudder. This may improve control authority at low speed, but it can also increase trim changes, hinge loads, and control sensitivity. Measure or simulate the slipstream influence during the transition from power-off glide to powered climb.
Clockwise and counterclockwise propellers are not interchangeable when blade twist, airfoil camber, or hub geometry is directional. Clearly label the rotation direction, motor phase configuration, propeller part number, and installation orientation in the production documentation.
Create a map with advance ratio on the horizontal axis and thrust coefficient, power coefficient, or efficiency on the vertical axis. Overlay the aircraft’s expected takeoff, climb, loiter, and maximum-speed conditions. This reveals whether the propeller spends most of the mission near its efficient region.
Endurance alone can hide an inefficient aircraft. For a mapping mission, calculate watt-hours per kilometer or watt-hours per square kilometer. A propeller that reduces cruise power from 700 W to 640 W provides an 8.6% reduction at the same airspeed. Over a 2-hour mission, that difference represents 120 Wh before accounting for battery reserve strategy.
Computational fluid dynamics can identify separated flow, wake distortion, and propeller inflow non-uniformity. For higher-confidence validation, use tufts, pressure taps, five-hole probes, or anemometry where practical. The purpose is not to produce an attractive flow image; it is to quantify how the airframe changes the local velocity and angle of attack across the propeller disk.
Propeller noise is affected by tip speed, blade loading, blade-passing frequency, motor commutation, and structural transmission. Reducing RPM while increasing diameter can lower tip speed, but only if the airframe has sufficient clearance and the motor can provide the required torque. For surveillance UAVs, measure sound pressure level at a defined distance and operating condition instead of describing a system as “quiet.”
A prototype may perform well while a production aircraft develops vibration because of tolerance stack-up. Control propeller adapter runout, motor-mount perpendicularity, shaft concentricity, blade mass variation, and fastener torque. Establish acceptance limits and inspect a sample of production assemblies with the same measurement method used during qualification.
Start with aircraft mass, target cruise speed, required climb rate, battery voltage, motor torque, and available diameter. Compare candidate propellers at static, climb, and cruise operating points. Select the propeller that meets thrust and speed requirements without exceeding continuous current, temperature, vibration, or clearance limits.
No. A larger diameter can reduce disk loading and improve ideal propulsive efficiency, but it may increase power demand, torque, structural loads, ground-clearance risk, and noise. The correct diameter is limited by the airframe, motor, RPM, and mission operating point.
Use a tractor layout when clean inflow, cooling, and low-speed thrust are priorities. Use a pusher layout when a clear nose is required for sensors or payload access. The final choice should be based on installed thrust, cruise power, thermal behavior, vibration, payload performance, and recovery risk.
There is no single clearance value that applies to every aircraft. The required clearance depends on propeller diameter, blade flexibility, motor-mount stiffness, landing attitude, structural tolerances, and recovery method. Model the complete propeller arc and validate it under maximum expected deflection and landing conditions.
The airframe may create non-uniform inflow, blockage, wake losses, or propeller-disk interference. Test-stand measurements are often made in relatively clean air, while an installed pusher propeller may operate behind the fuselage and wing. Compare installed flight data with bench data at similar RPM, voltage, and airspeed.
Balance the propeller statically and dynamically, inspect the shaft and adapter, verify motor-mount alignment, tighten fasteners to the specified torque, and measure vibration near sensitive equipment. If vibration remains, examine blade tracking, bearing condition, fuselage resonance, and propeller wake interaction with the empennage.
Rayi can be contacted for fixed-wing UAV propeller consultation, configuration matching, sample evaluation, and integration support. Provide the aircraft mass, battery voltage, motor data, target airspeed, mission altitude, propeller clearance, and desired thrust points so the recommendation can be based on measurable operating requirements.
For a professional UAV program, use the following release process:
A successful fixed-wing propeller system is defined by measured performance across the complete aircraft mission, not by diameter, pitch, or static thrust alone. Integrators should evaluate fixed-wing UAV propeller selection, fixed-wing drone cruise efficiency, and pusher propeller clearance for UAV aircraft together with propulsive efficiency, airframe-propeller interference, and thermal management. The key professional checks are the advance ratio, disk loading, and thrust-line moment.
For propeller matching, prototype evaluation, and production-oriented integration support, contact Rayi with your aircraft specifications and test requirements. A data-based selection process can reduce rework, protect payload performance, and provide a repeatable propulsion configuration for the next UAV flight-test campaign.
Aug. 11, 2026

